For almost a decade, DuKode has developed visualizations, software, and 3D animated models with environmental map data. Recent projects include
- DuKoder Map: Stage 1 Feasibility Studies
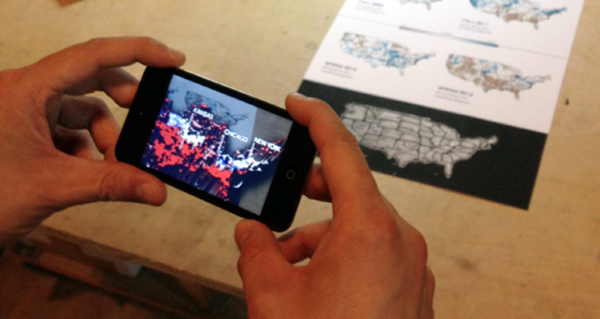
Without the app, the map shows a beautifully embossed topography of the U.S., but when viewed through the DuKoder Map app, the map comes alive with 3-D geographic data visualizing how our water ecosystems are affected by climate change. - OpenIR (MIT Media Lab)
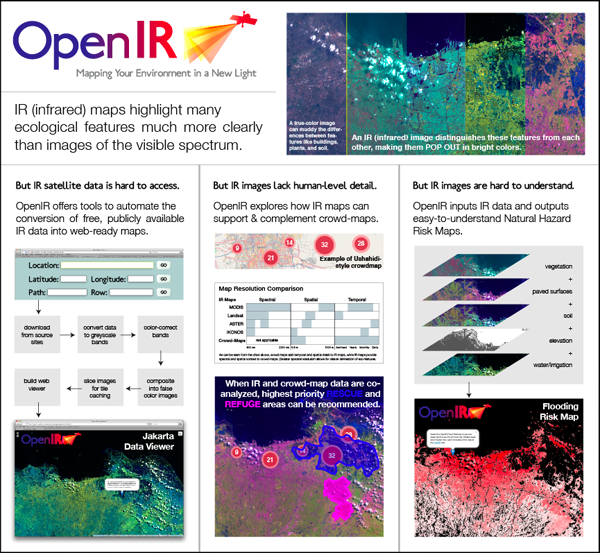
OpenIR (Open Infrared) maps the ecological features and risks revealed by infrared satellite data. OpenIR’s software has been pilot tested in Jakarta and NYC for flood management, as well as Borneo for deforestation tracking. OpenIR’s development has been supported by the MIT Media Lab and the MIT Public Service Center. - Ai Weiwei’s Fairytale Project (Slought Foundation)
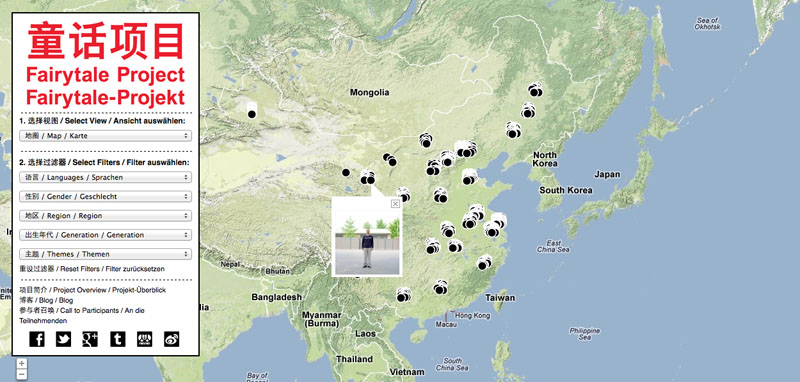
In 2007, Chinese artist Ai Weiwei initiated “Fairytale,” in which 1001 Mainland Chinese People were invited to Kassel, Germany to view and participate in Documenta 12. In 2011 Ai Weiwei and Hong Kong-based curator Melissa Lam translated and curated documents that the artist collected over the course of the project, and DuKode visualized the result. - Subduction Geology (Elumenati, Pearson Education)
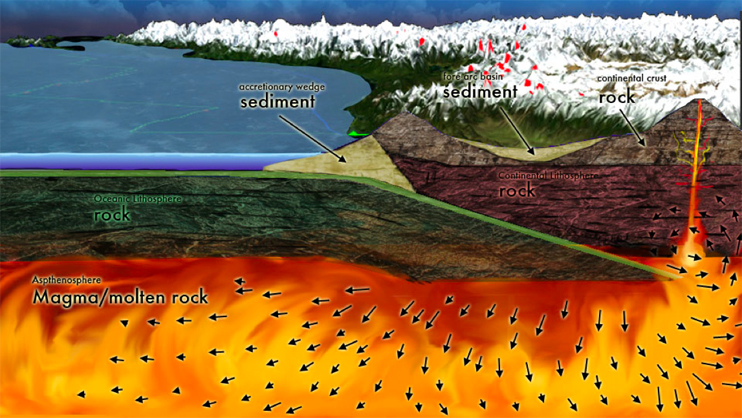
A 3D-simulated earthquake-prone subduction zone in a global context. The simulation illustrates how interdependent factors in Earth’s geological system influence each other. - Protecting Wildlife in a Changing Climate (AMNH Science Bulletins Series)
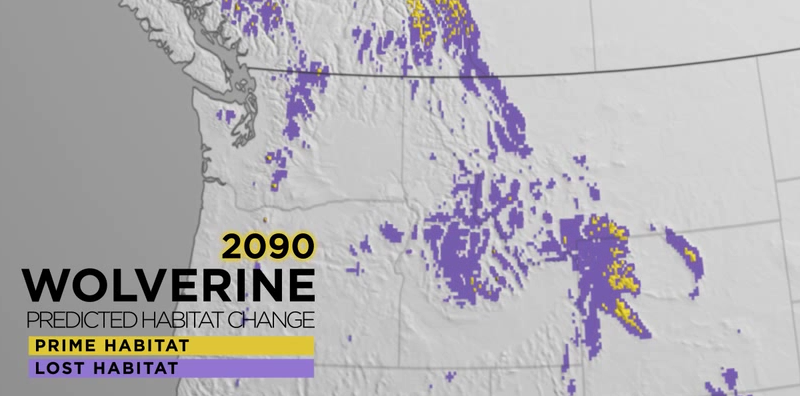
As global climate changes and alters natural habitats, wild animals are shifting where they live on Earth. Protecting them requires connecting crucial protected areas so species can move safely among the habitats they need to survive. This visualization uses the wolverine as an example–a northern species particularly sensitive to climate change. - Topography Ceramics

Inspired by our visualization projects that implement topography and maps through Maya CAD software, we’ve started to bring our visualizations into the physical world through hand-built and 3D-printed ceramics. Custom-mixed glazes will be algorithmically applied to represent climate-related datasets.

